Repository navigation
What to do about ozone in MTso #413

Replies: 7 comments 6 replies

|
Here's what we have done in the past CESM1-LE (Kay et al. 2015)
CESM2-LE (Rodgers et al. 2021, but ozone described in Danabasoglu et al. 2020)
The question now is how inappropriate is it to just use a single member of MTt4s to obtain the ozone forcing given how expensive / how much longer it would take to run more members. If we only use one member, should we do some additional smoothing to limit the high frequency variability? |
|
Here's a look at ozone in the SH springtime (SON) at 70 hPa, 90S-70S in various different datasets. Here are time series of anomalies relative to the 1920-1950 average. The left shows various different CESM values. The gray are the 3 members from WACCM6 that were run for CMIP6, blue is the ozone that was used for the CESM1 large ensemble, red is the ozone that was used for the CESM2 large ensemble. The gray lines, therefore, demonstrate how different the ozone variability we impose would be if we only used a single member compared to what we've done in the past when we've tried to only impose the forced ozone changes and not the variability that could arise internally in a single coupled chemistry simulation. The right plot shows the CMIP7 ozone forcing downloaded from input4MIPS. I used the FZJ-CMIP-ozone-2-0 version as suggested. The interannual variability in the CMIP7 ozone dataset is similar to in individual WACCM members suggesting that the CMIP7 dataset is actually not smoothed or ensemble averaged, but rather is coming from a single simulation. 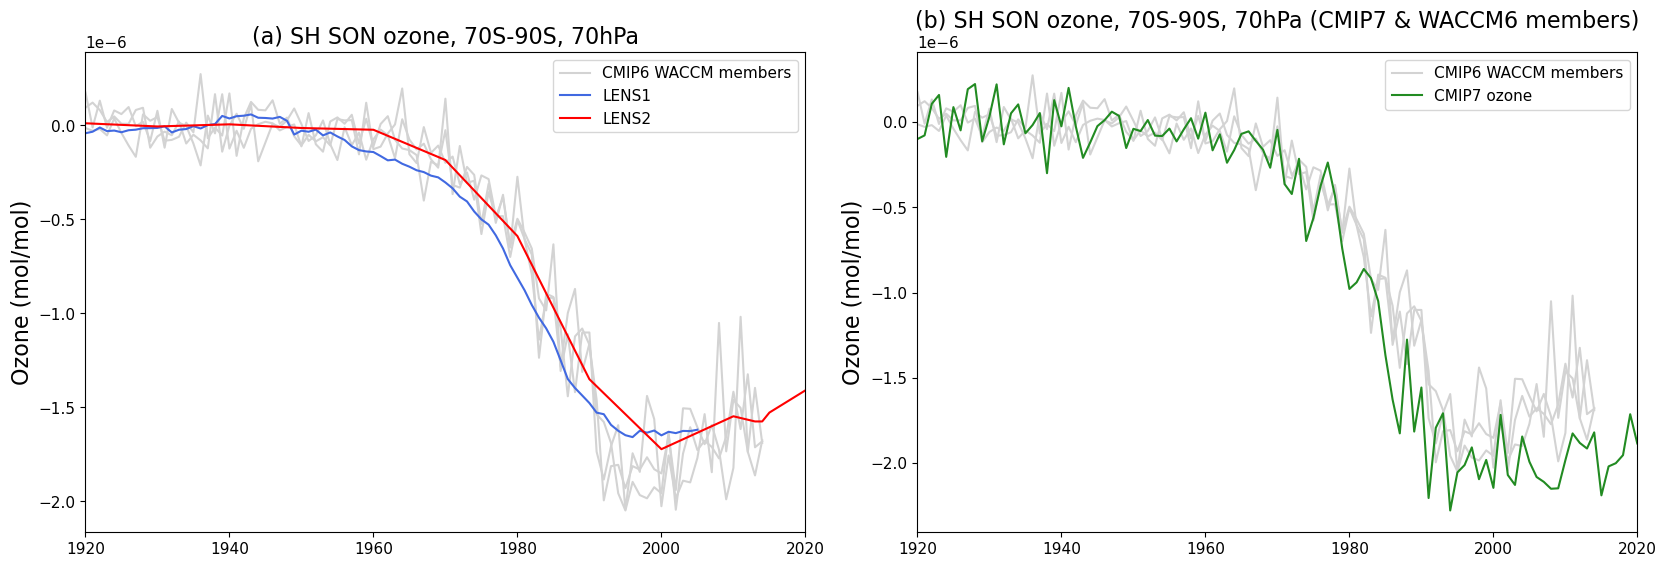
Here's a plot of the standard deviation of 10-year high pass filtered ozone at 70hPa 90S-70S to be more quantitative about that. This demonstrates that the high pass filtered variability in the CMIP7 dataset is similar to what we would have with a single WACCM member. 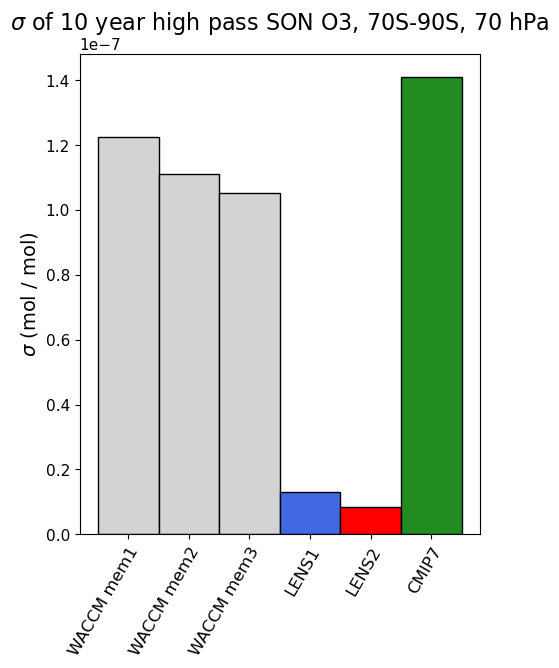
Here's a look across seasons in the latitude-pressure plane at the 10-year high pass filtered variability that's present in these various datasets. This demonstrates how much more high frequency variability we'd be imposing compared to the smoothed versions we've used for the CESM1 and CESM2 large ensembles, but also demonstrates that the CMIP7 forcing dataset looks like it's doing something similar. 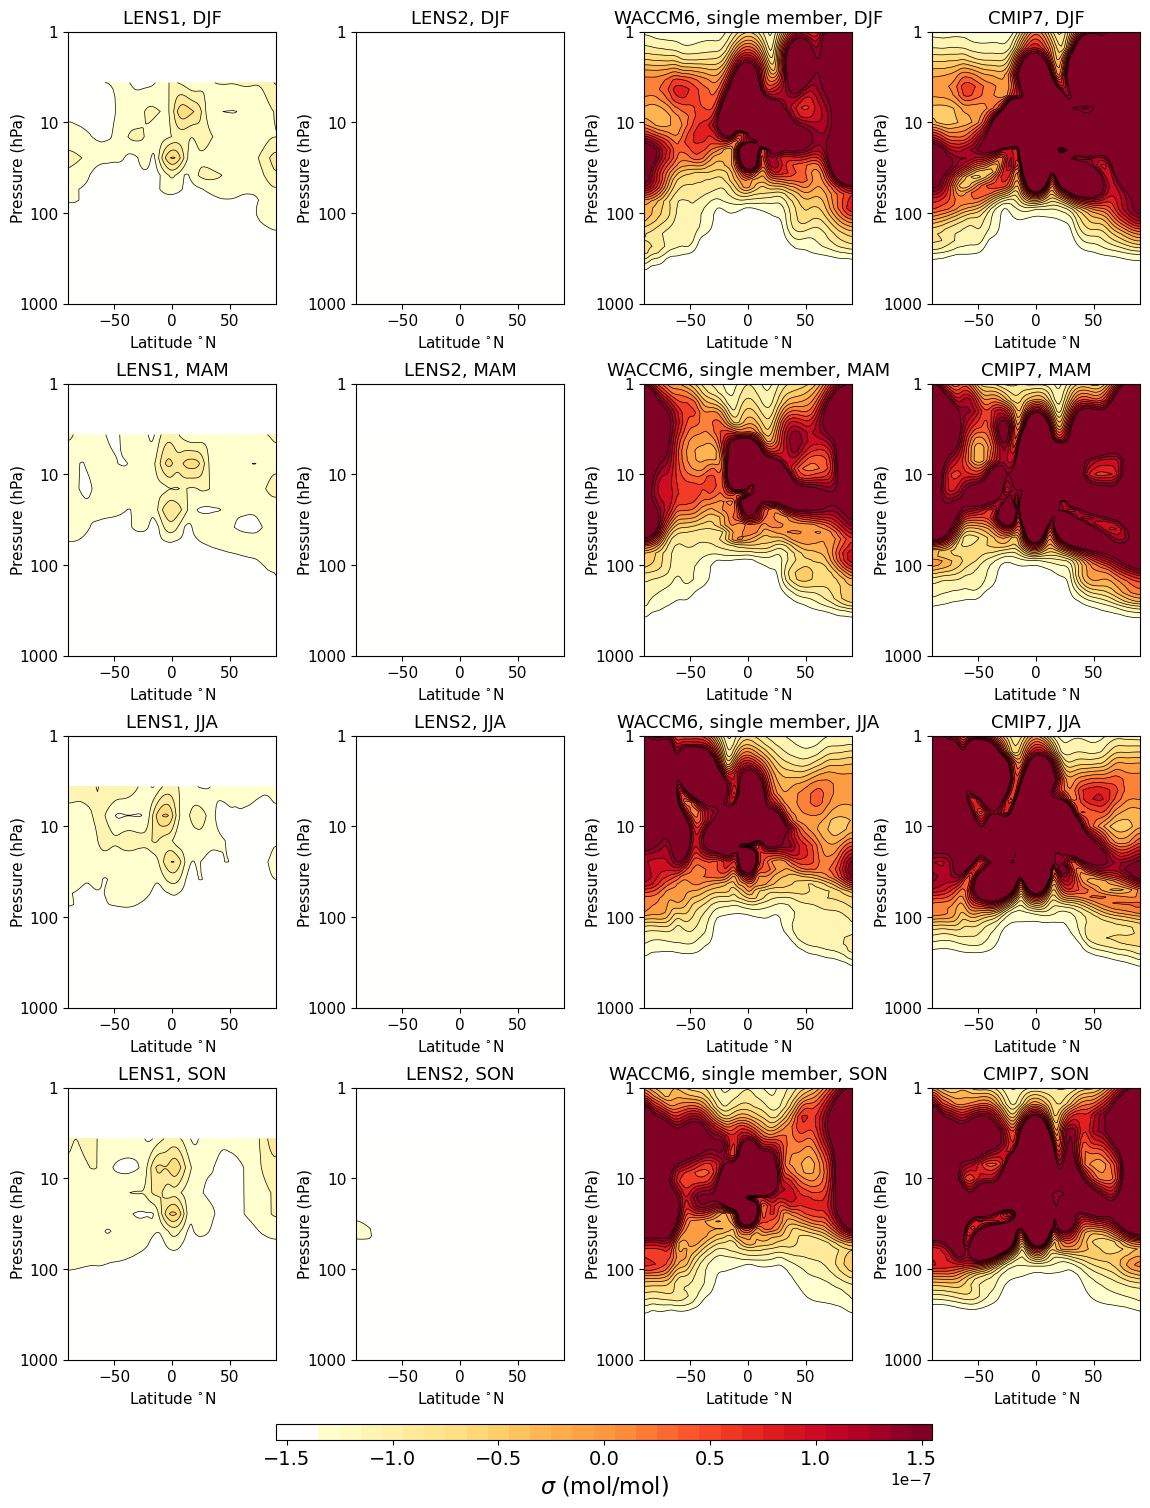
I'll try to find out more about where the CMIP7 forcing dataset has come from. |
|
Here's a look at what SH springtime ozone at 70hPa, 70S-90S would look like when smoothing a single member by varying degrees, using the 3 CMIP6 WACCM simulations as an example. The number refers to the number of years in the running mean. 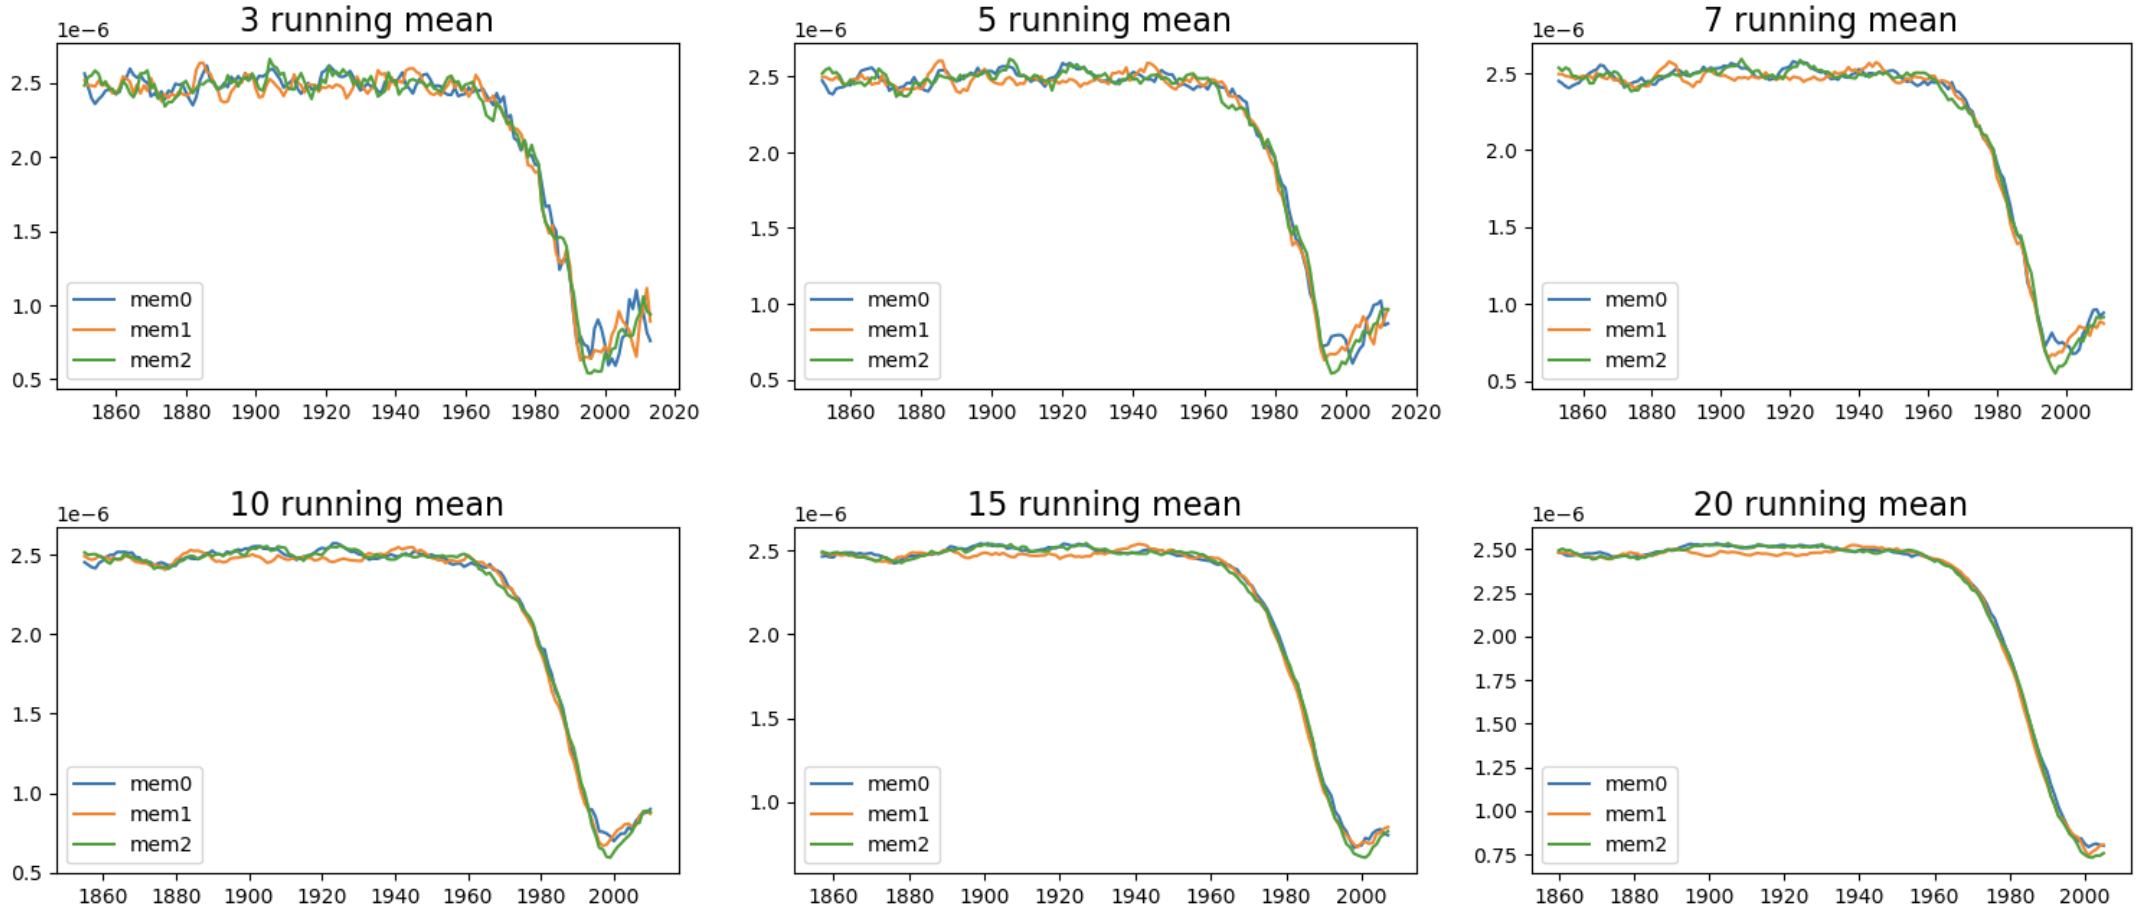
|

|
The spread across the WACCM members in stratospheric AOD is small compared to the externally forced signal. Here's the monthly the global average stratospheric AODVIS for the 3 CMIP6 WACCM members... 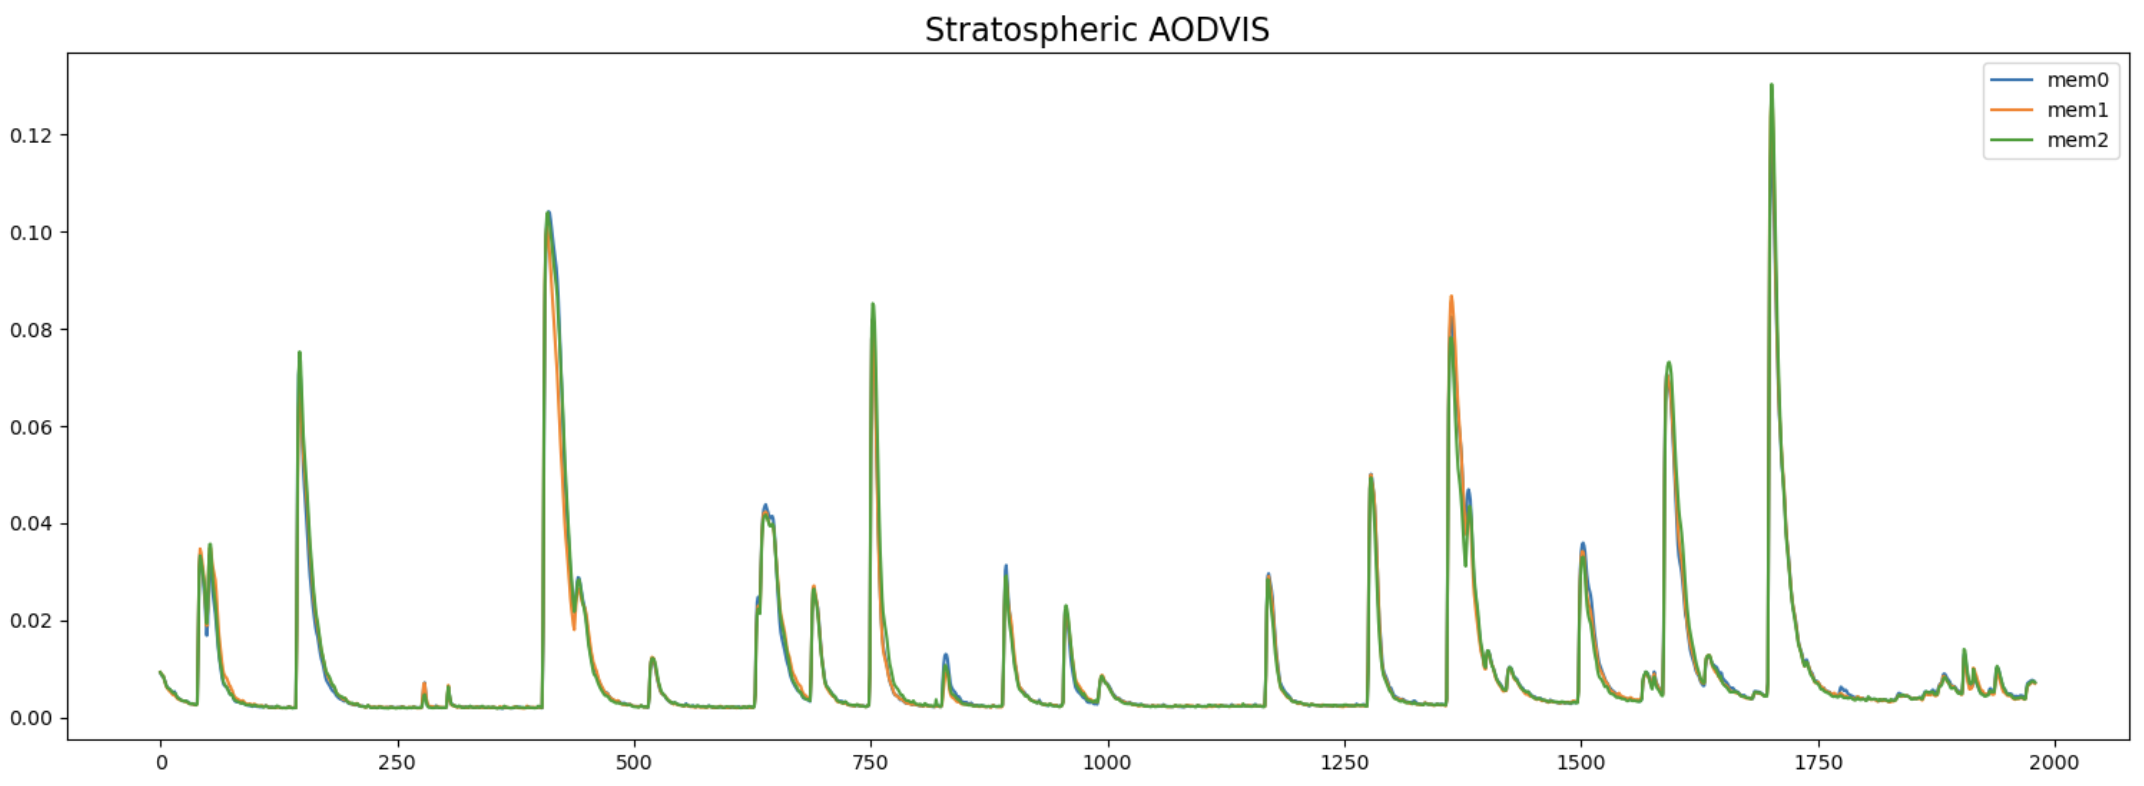
Here's what that would look like if we applied the same smoothing procedure as done for ozone above. Pretty sure we don't want to be doing that! The weird structures are arising because the smoothing is done on each month of the year separately and here I'm plotting monthly values. 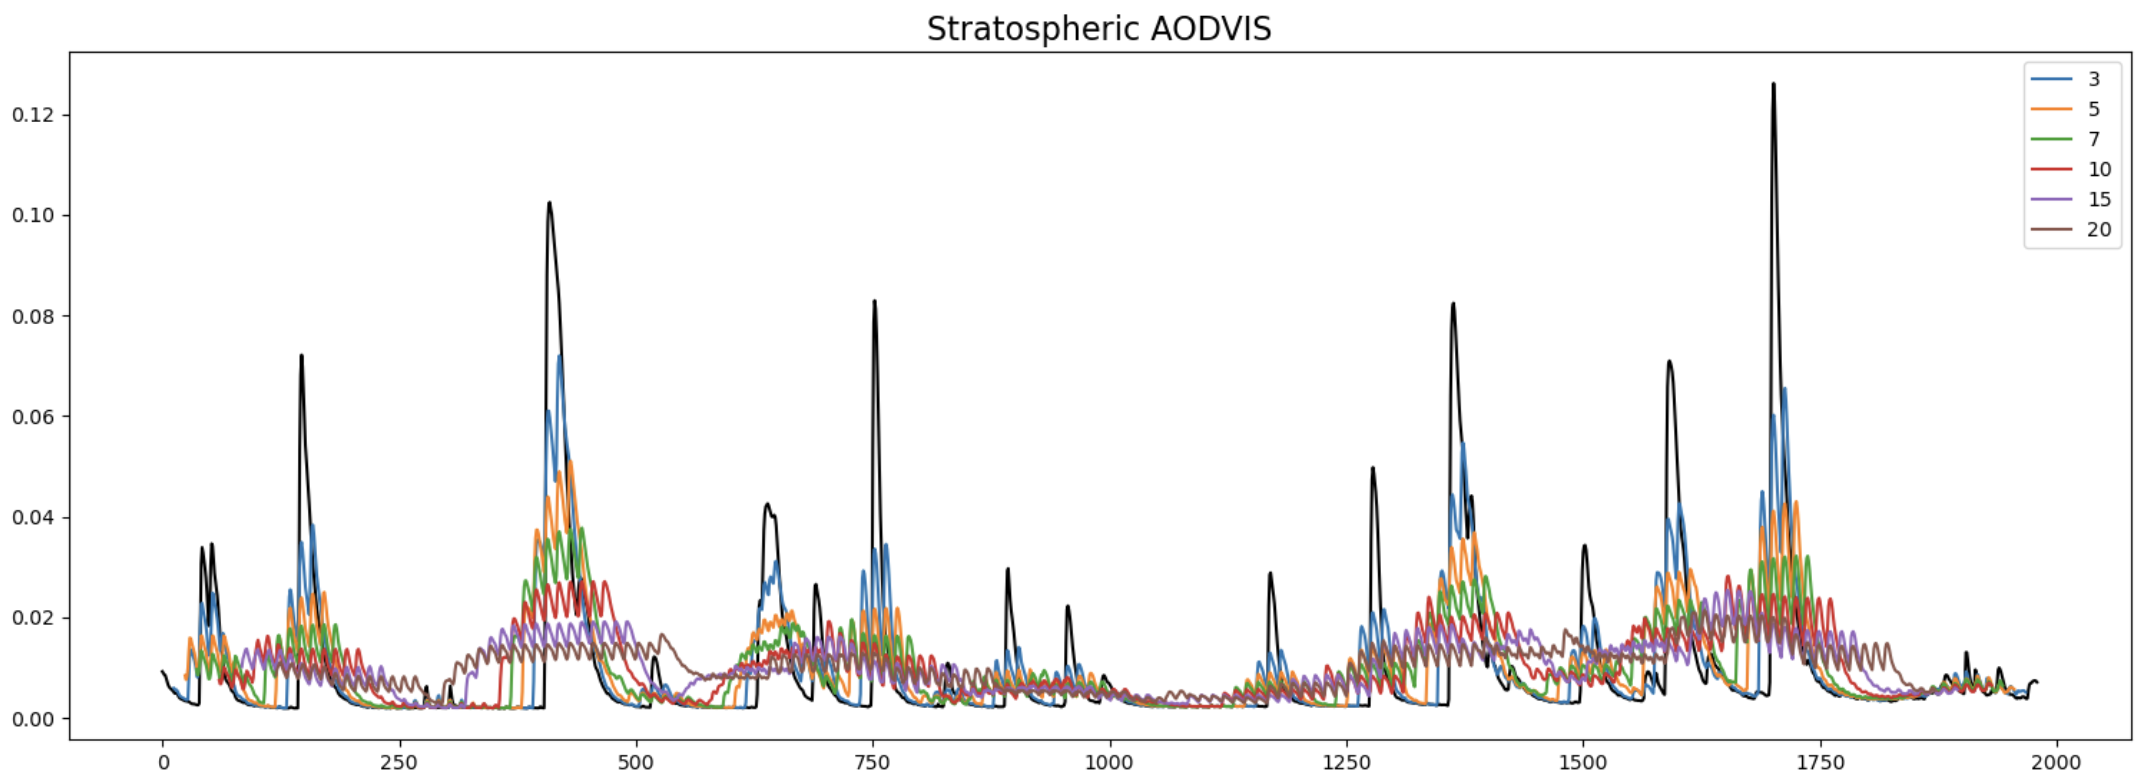
|
|
It seems like a reasonable approach would be to leave volcanic forcing alone and perform some kind of smoothing on ozone to limit the impacts of internal variability. It probably would be good to check how different the climatological seasonal cycle of ozone is between a linear interpolation between monthly means and the 5 day means before making a decision on what to do there. @tilmes - let me know if you want me to take a look at that or if you will take care of that. @dlawrenncar |

|
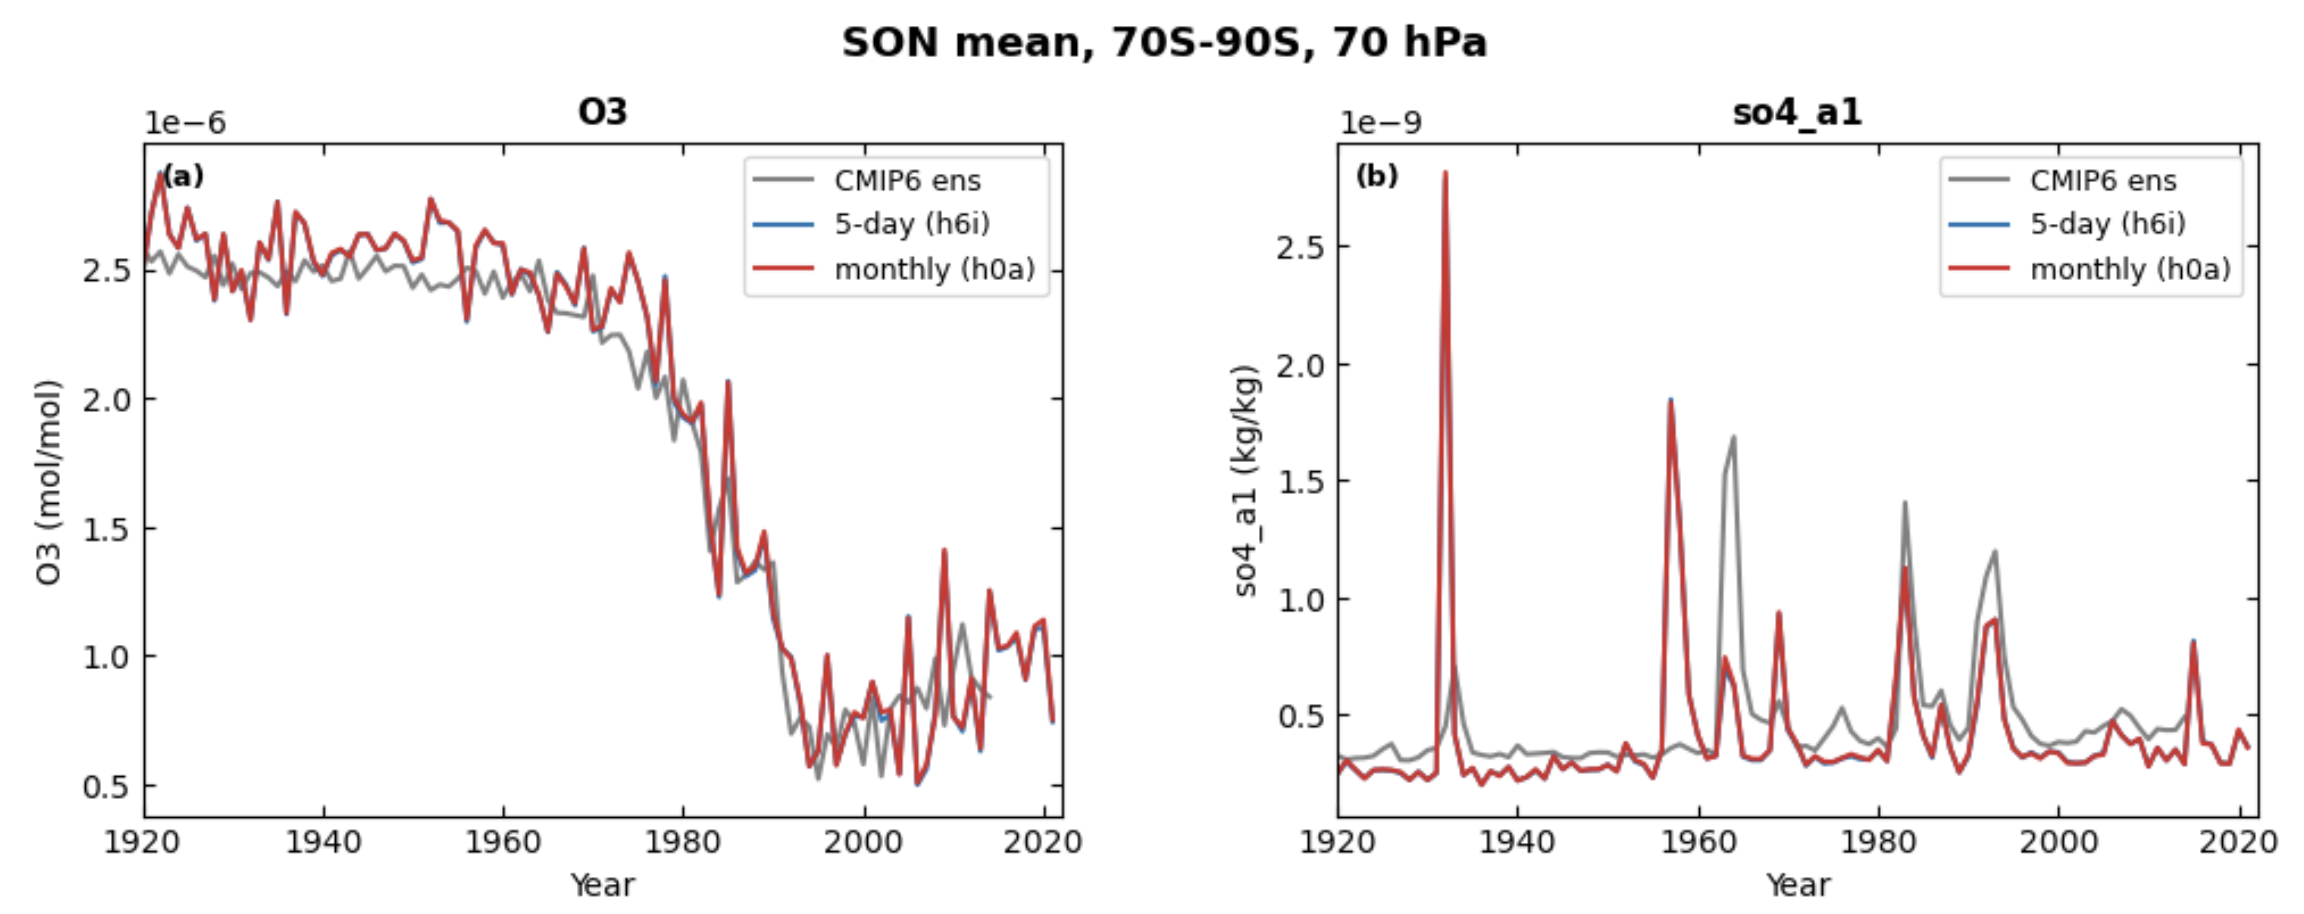
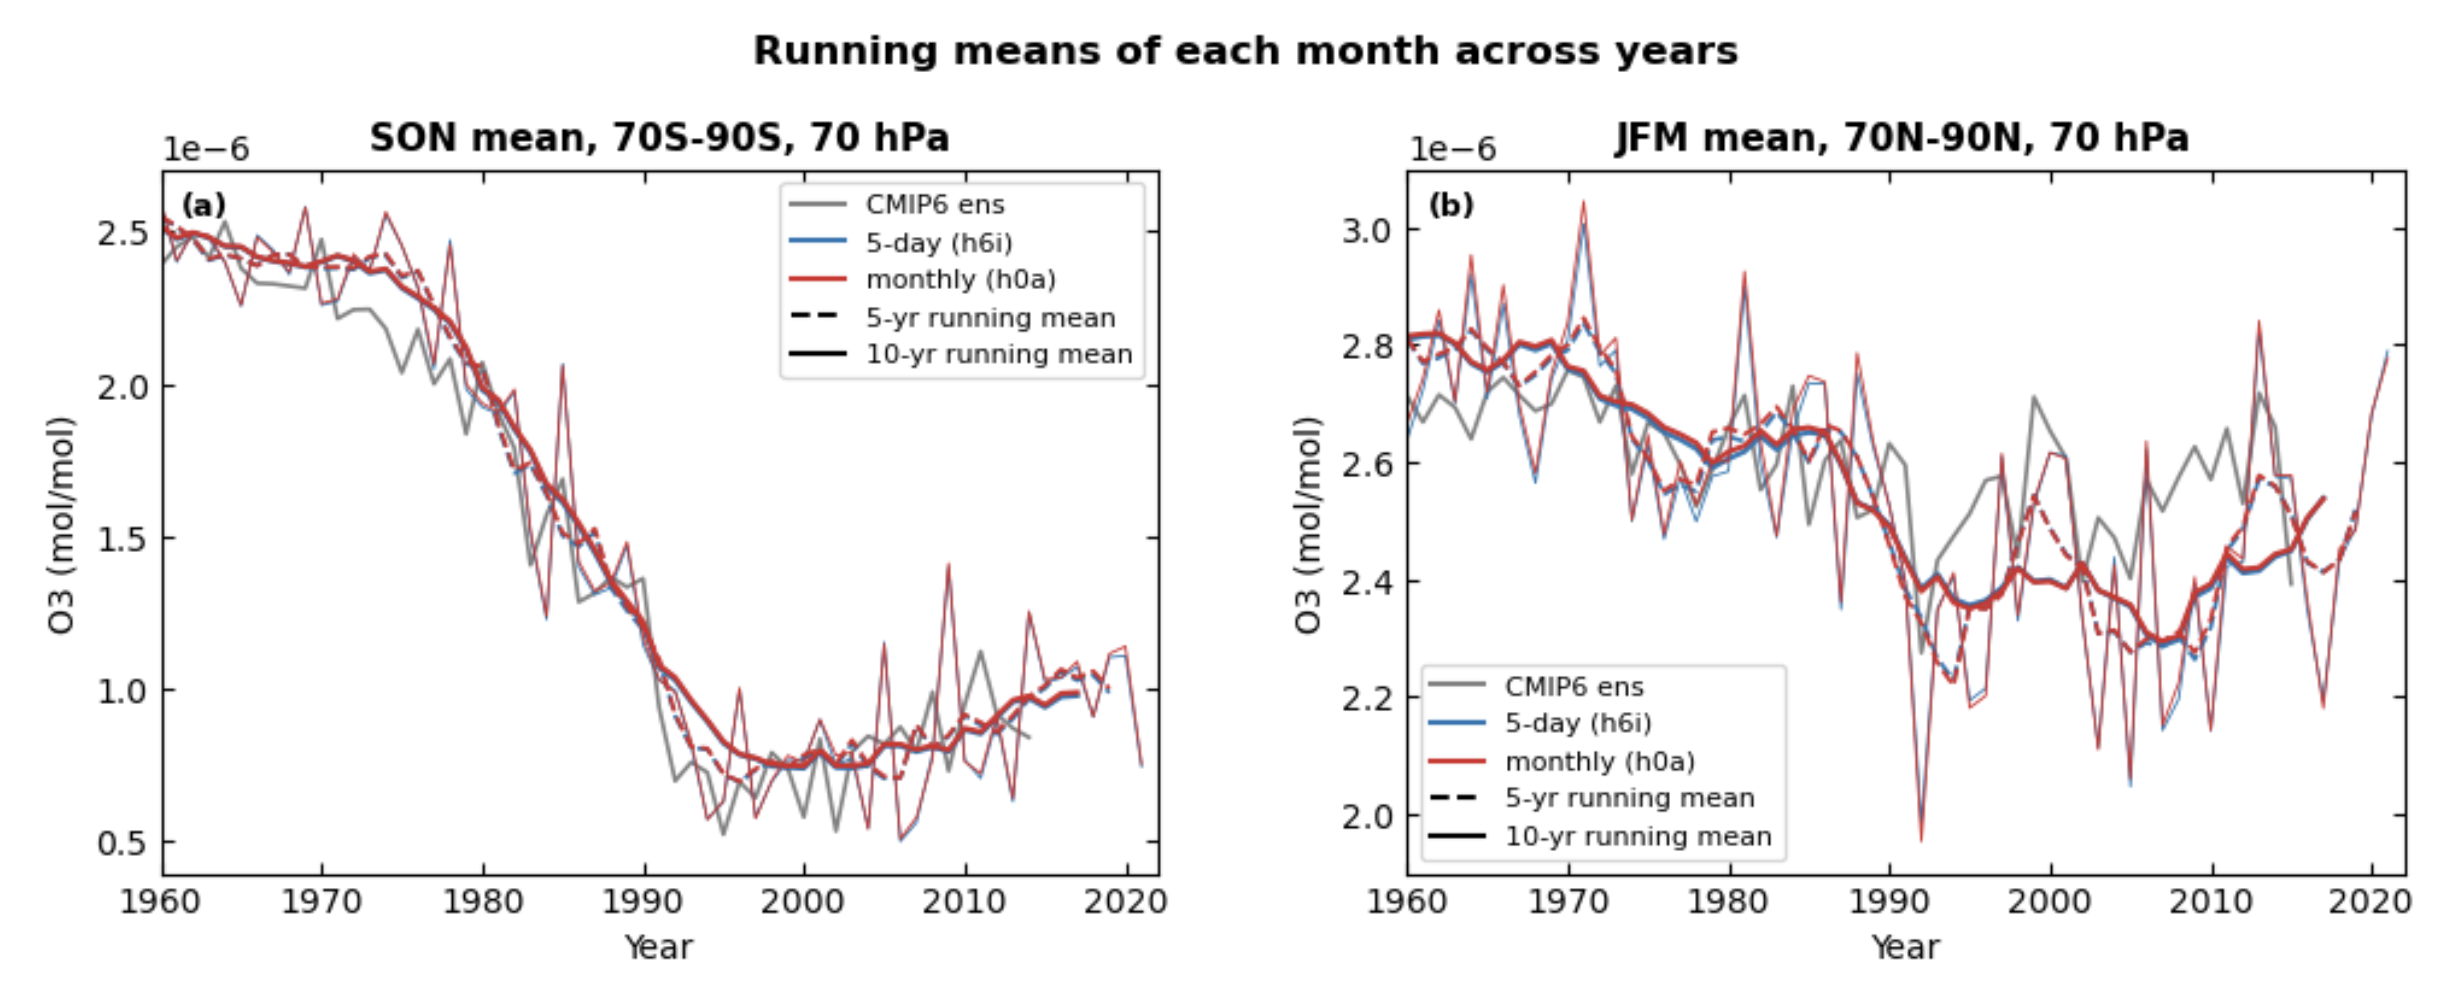
Here are some analyses I performed with our new CESM3 Historical simulation, 1 ensemble member, compared to the CMIP6 forcing dataset. To be clear, I checked, the CMIP6 forcings are the same for volcanoes and ozone, and we use the 5-day instanteous output for the historical simulations, without any smoothing, but applied an ensemble mean using 3 ensemble members. Here is a comparison of the historical dataset for a 5-day output and the monthly output, for the same area averages and season as what Isla was showing: We can see that using monthly vs 5-day average for the new runs is not very different, and that we have more variability than what we used for cmip6, because this is just 1 ensemble member. Now, if we look at the same data, not averaging, but plotting each data point, we do see that the 5-day output provides quite a bit deeper ozone hole values than the monthly output. This is, of course, the reason why we use the 5-day output in the first place. 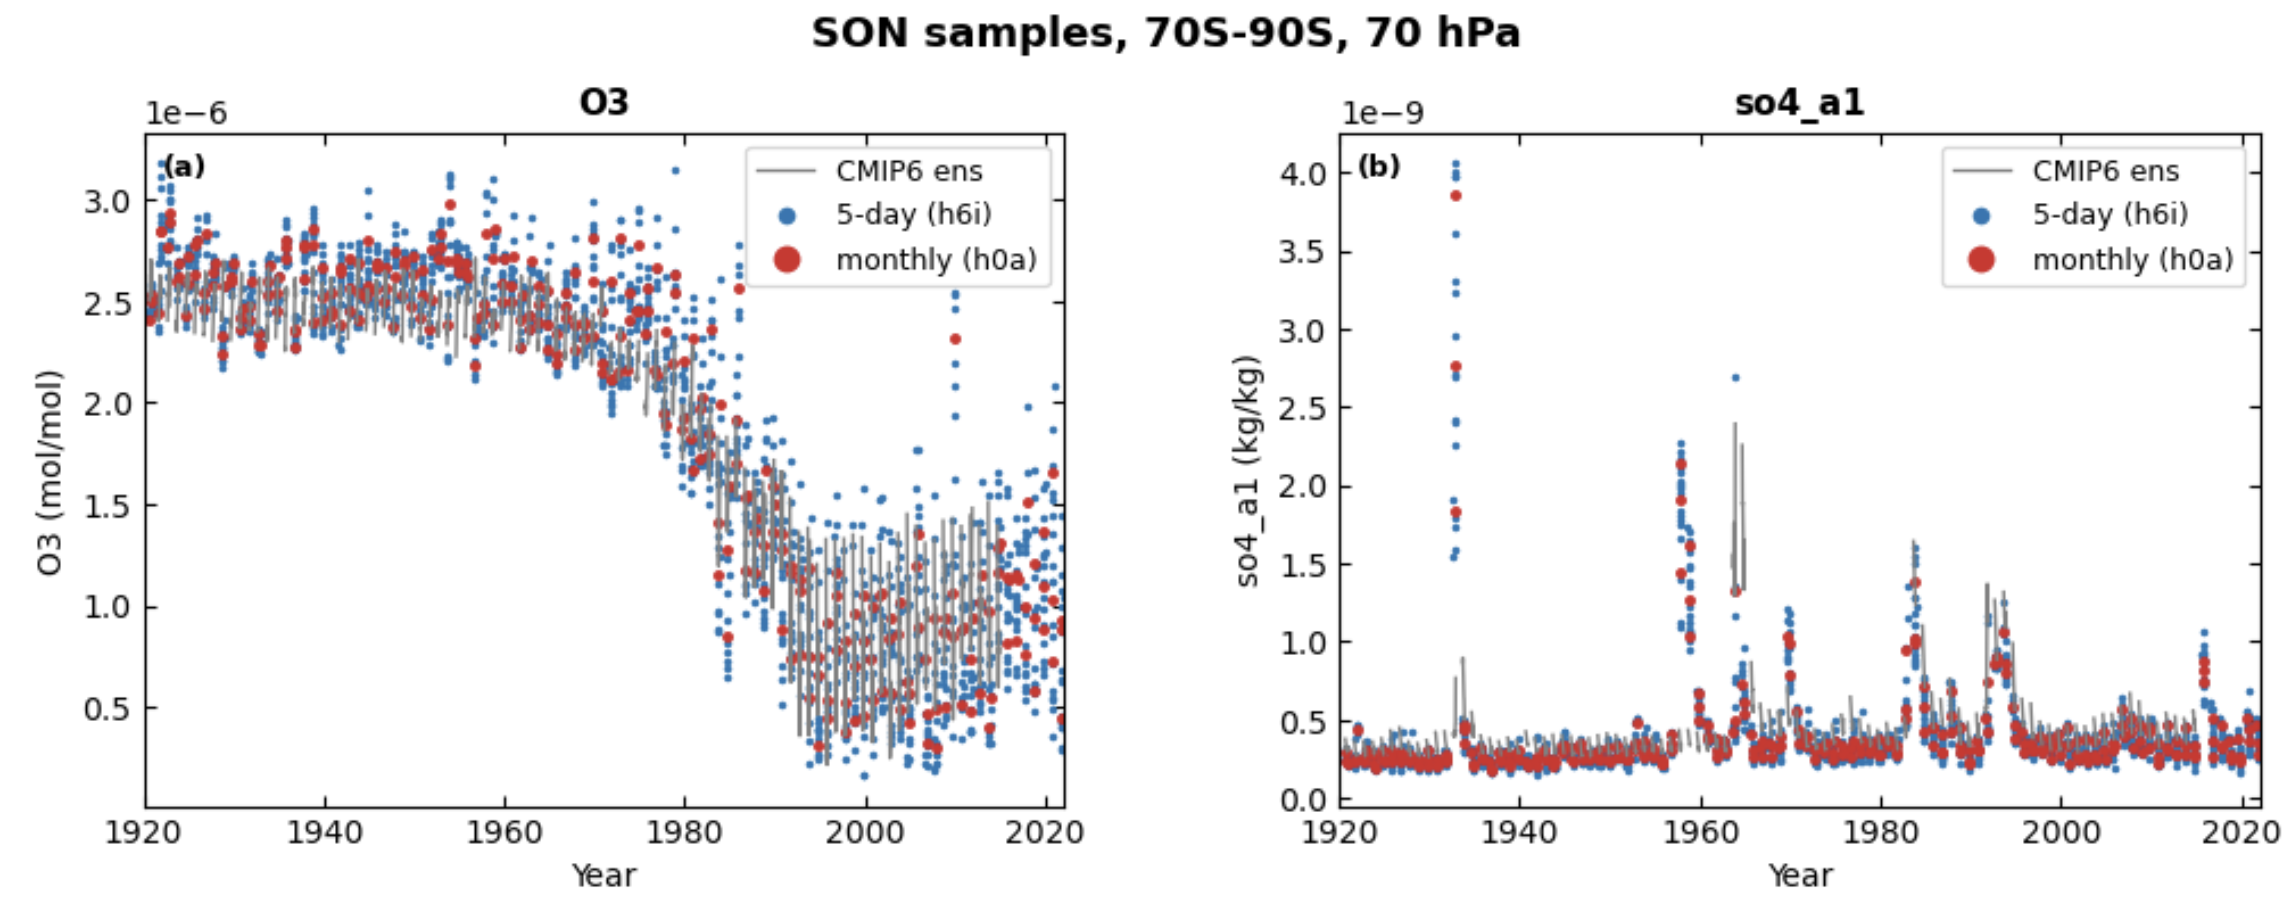
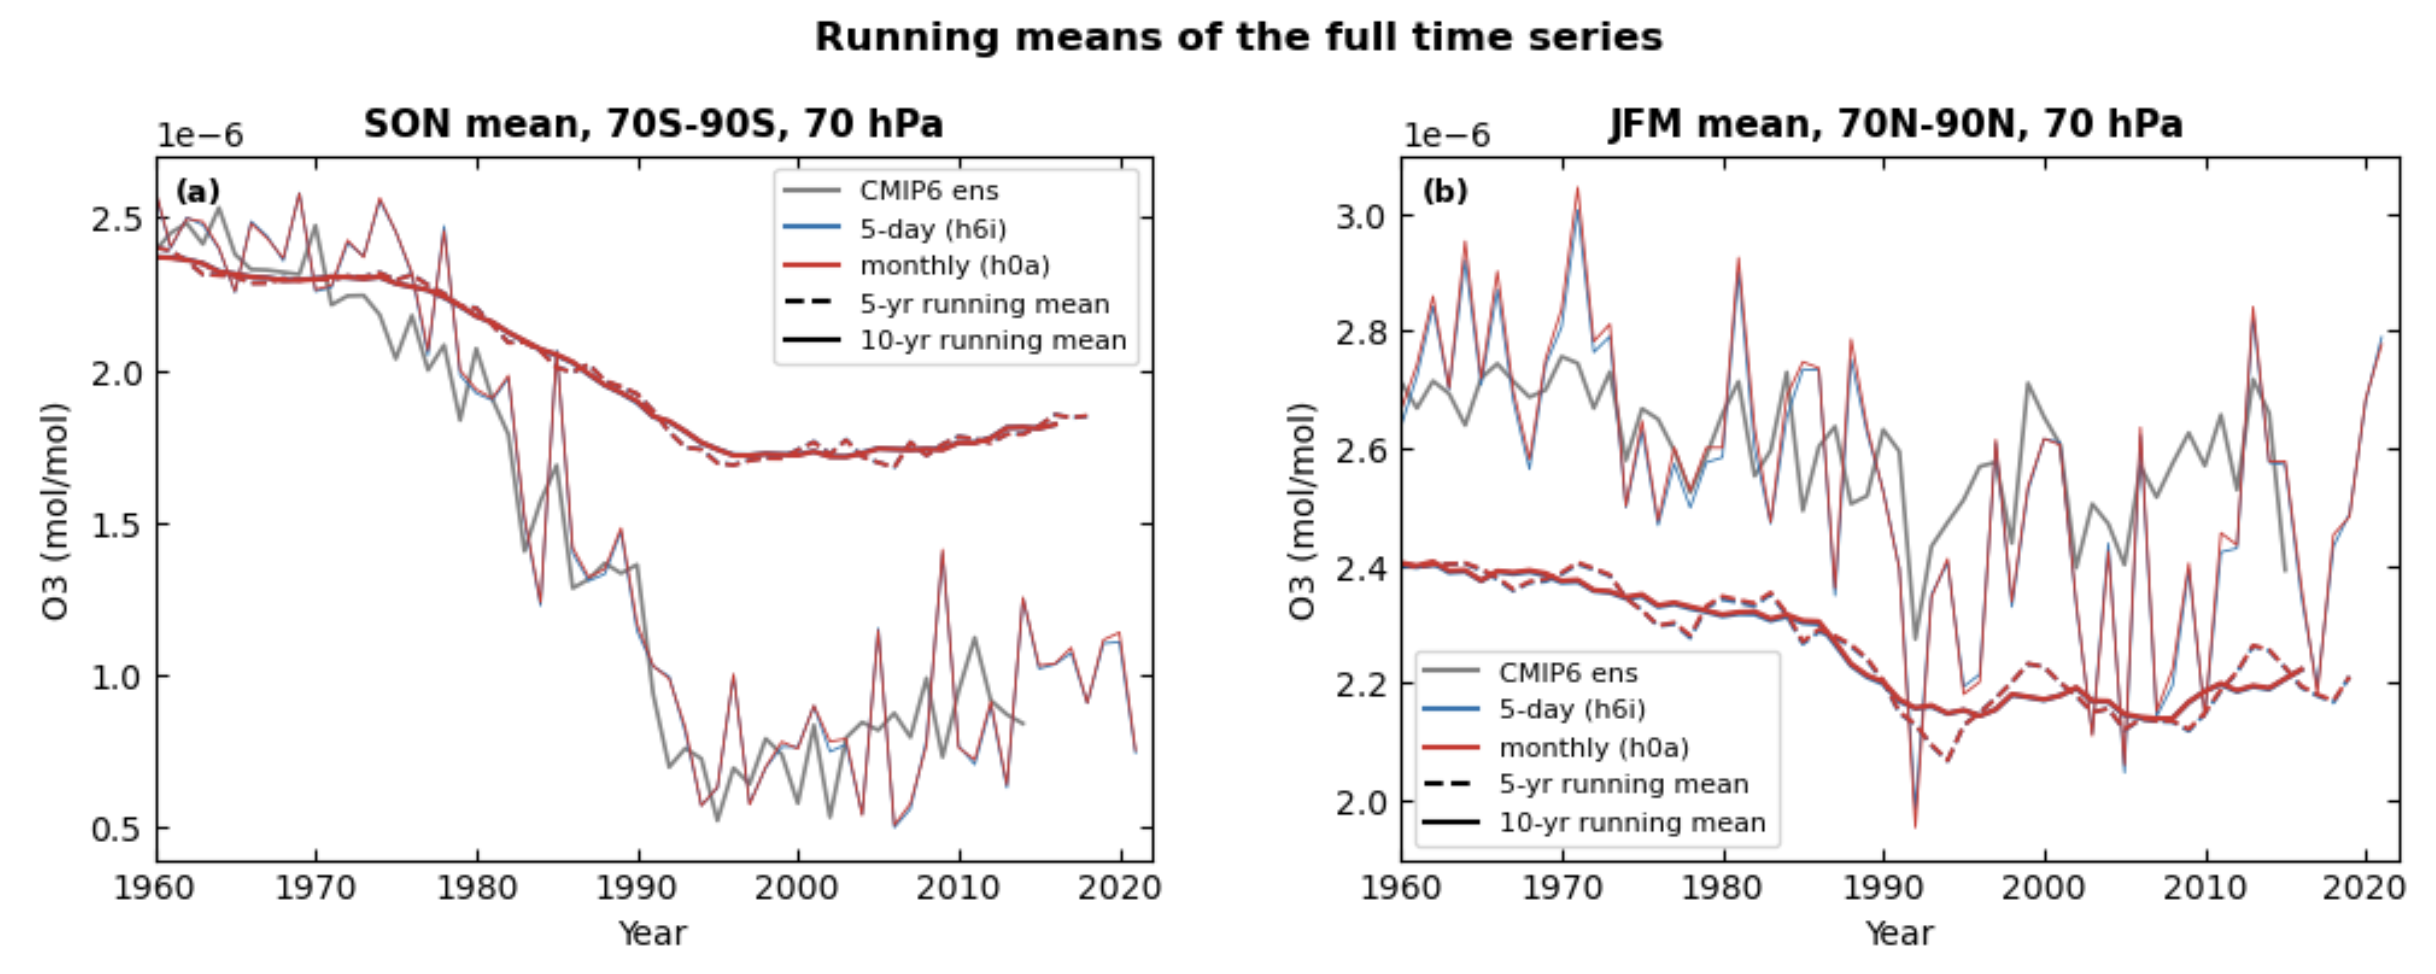
However, since we may want to apply some smoothing for ozone, I applied a running mean on the dataset for 5-years and 10 years. For the SH the 5-year running mean still captures the reduction of ozone after 1990, however, the 10-year one smoothes that signal out. For the NH, we see some more variablity, since warm and cold winters fluctuate a bit. I would prefer if we do smoothing, it should be the 5-year one not the 10-year one. That is still much smoother than what we did in cmip6, even with the 3-ensemble mean. Finally, we need to be careful and don't want to apply the smoothing to the full timeseries, and then look at the different months, since else we get very different values: So, again, in summary, probably 5-day output is not required for the simulations. However, I am still checking with Doug what they use for the forcings for the other models. Regarding aerosol forcing, probably monthly datasets are also OK, but we get somewhat smaller forcings for the peaks. |

|
P.S. I want to talk to Doug Kinnison about this as well. |

|
Thanks for this analysis Isla and Simone. I agree that it doesn't seem that starting from 5-day data or monthly data makes any difference for ozone. A running average of 5 to 10 years seems to work ok. I'm not sure I see that much difference in the SH ozone hole trend either in the loss or recovery phase with 5 years relative to 10 years. It's a small amount deeper with the 5yr smoothing, but it's hard to tell if that is just down to some internal variability that is affecting the ozone hole over that period. With the 5-yr running avg, you do see some evidence of internal variability with some waviness in the signal. Perhaps a 7-yr running avg as a compromise. :). Either way, I'm not an expert in this, so maybe small changes in the depth of the hole is really of importance. Agree that it seems that no smoothing of aerosols makes sense. Not sure about 5 days vs monthly input there. Maybe we should do whatever we did before so as to not need to develop new code. What about the other fields? Nitrogen deposition, Tropospheric oxidants, H2O production rates due to CH4 if they are needed (is this the full list?). |
|
Regarding the small differences between 5-day and monthly, picking a single ozone level may not capture the full extent of the differences; looking at total column ozone is better. |
|
I am also not sure about the argument for 5 yr vs 10 yr since we don't know whats variability and what's forced. |
|
I think we do know pretty well that Mt. Pinatubo reduced ozone by a bit, and the drop in ozone is very clear in both CMIP6 (based on 3 ensembles) and the new 1-ensemble run. |
|
Hi Dave, For the transient simulations shown above, again, the seasonal cycle plots over 2000-2010 do show some differences 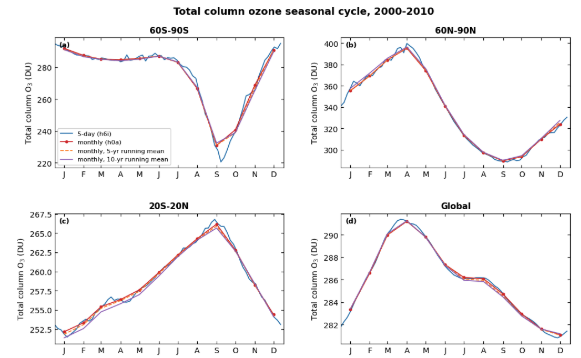
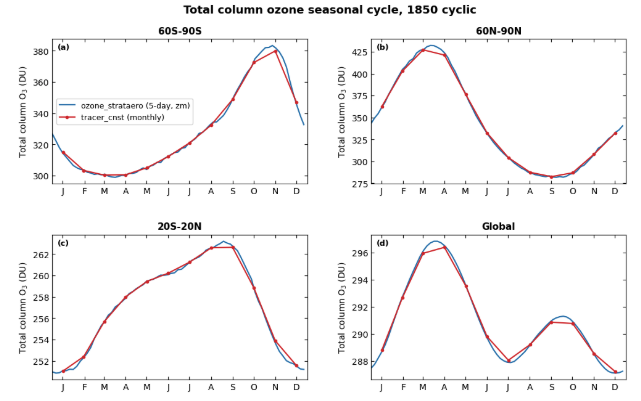
I also talked to Doug Kinnison; he suggested saving the 5-day output, since it isn't much of a burden to add. Regarding the smoothing and monthly output, looking at the deep ozone hole is a trade-off for having a more smoothed timeseries. However, Doug would agree that if we want to smooth, 5-year monthly smoothing would be best if we want to remove the variability between the years, I think more smoothing removes the gradient we want to see in ozone in the 90ties. Finally, all the other forcing datasets have been processed for monthly mean output. We have not applied any smoothing. I am not really sure if we want to change that. There is certainly variability that we will introduce with one ensemble member, e.g., nitrogen deposition, oxidants, but I am not sure if it would be as critical as stratospheric ozone. But maybe @islasimpson has a better feel for it. |
|
I have no idea about variability in nitrogen deposition and oxidants. I agree that these differences in the seasonal cycle make it worth using the 5-days. But I guess that would make the time series we're imposing at any given time more noisy. It doesn't show up in the SON analysis because that's already averaged over SON. I think I'm still a bit unconvinced that 5 yr mean has more positives than a 10 yr mean but I guess since the CMIP time series that other people are using is already so noise, maybe it's OK. |


Uh oh!
There was an error while loading. Please reload this page.
Here's a place to discuss our options for ozone forcing in MTso
All reactions