
Energy Consumption Forecast towards Net Zero Transition
Quoting from Mc-Kinsey, “We’re in the midst of an energy transition that continues to evolve.” With the increase in global temperature and climate change, an international program, namely Net Zero Emission, was established. Net Zero 2050 is an ambitious scenario that limits global warming to 1.5 °C through stringent climate policies and innovation, reaching net-zero CO₂ emissions around 2050. One strategy in energy use is to shift the use of energy from fossil energy sources to renewable energy (renewable energy) so that the Energy Mix target emerges, namely by targeting the composition of renewable energy, namely 32% in 2035 and 50% in 2050. This project mainly provides insights into the longer-term trends that will continue to be essential in shaping future energy systems.

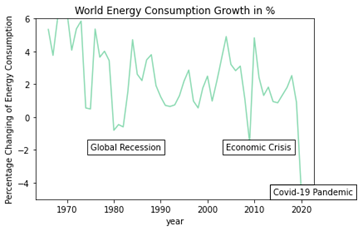 As shown in figure above, world energy consumption is increasing. It can be seen that most of the growth in global energy consumption was positive, except in 1980 due to the global recession, 2009 due to the global economic crisis, and 2020 due to COVID-19.
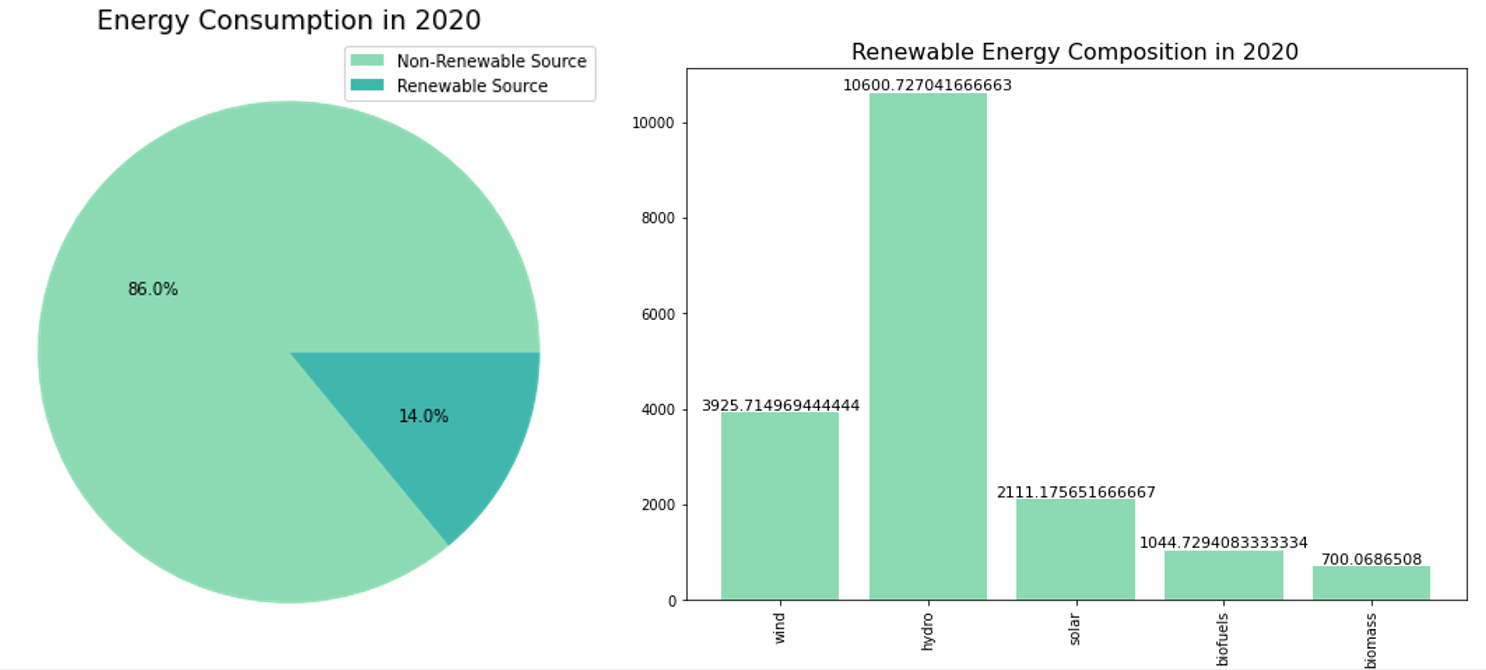 Based on the energy consumption data in 2020, renewable energy composition is only 14%, with the highest composition being hydro, wind, diesel, biofuels, and biomass.
The primary purpose of this analysis is to predict whether the energy mix composition from renewable energy will reach 32% in 2035 and 50% in 2050. Based on my purpose, I choose regression and time series machine learning to predict world energy consumption and renewable energy consumption in the future. Data-driven recommendations will be delivered at the end of the study.
Dataset can be found at https://ourworldindata.org/grapher/primary-sub-energy-source. This dataset outlines the number of terawatt-hours (TWh) consumed from 1965 to 2020 through various energy sources. Energy consumption by source datasets provides context about the quantity of energy required, how it changes over time, and how we are transitioning from non-renewable to renewable energy use.
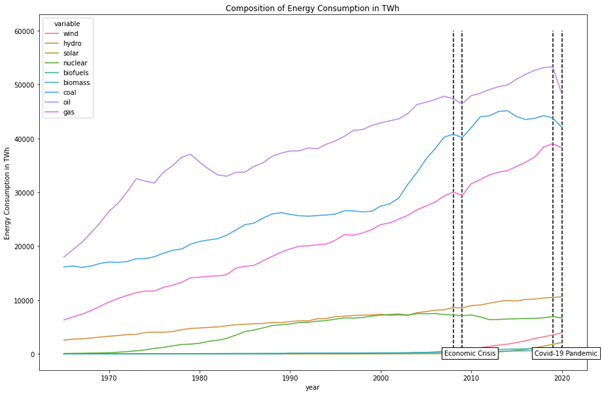 Most energy sources used are fossil energy, namely oil, coal, and gas. However, it can also be seen that renewable energy consumption is increasing every year. Meanwhile, from the correlation data, new renewable energy sources are correlated. In contrast, renewable energy sources developed longer, such as nuclear and hydro, are still correlated with non-renewable energy.
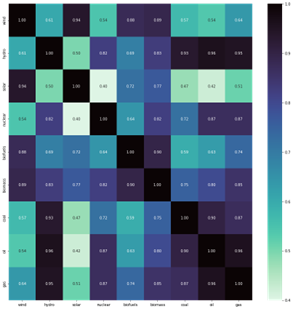
Observation:
- Wind energy is highly correlated with solar, biofuels, and biomass
- Hydro is highly correlated with gas, oil, coal, and nuclear.
- Solar energy is highly correlated with the wind.
- Nuclear is highly correlated with gas, oil, biomass, and wind.
- Biofuel is highly correlated with biomass and wind.
- Biomass is highly correlated with gas, oil, biofuels, nuclear, and wind.
- Coal is highly correlated with gas, oil, and hydro.
- Oil is highly correlated with gas, coal, biomass, nuclear, and hydro.
- Gas is highly correlated with oil, coal, biomass, biofuels, nuclear, and hydro.
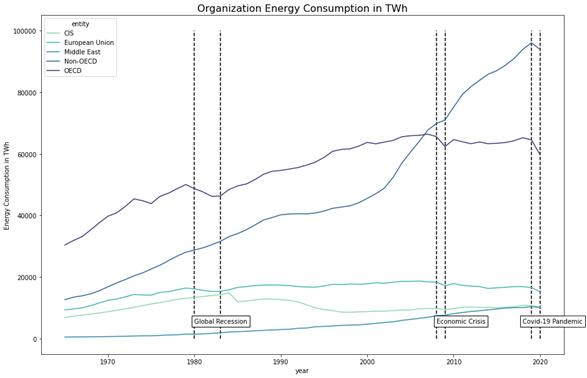
Initially, most energy uses was by OECD countries (countries in Europe and the US). Still, since 2008 the value has been followed by Non-OECD with the development of industry and shifting manufacturing in Non-OECD countries, especially the Asia Pacific.
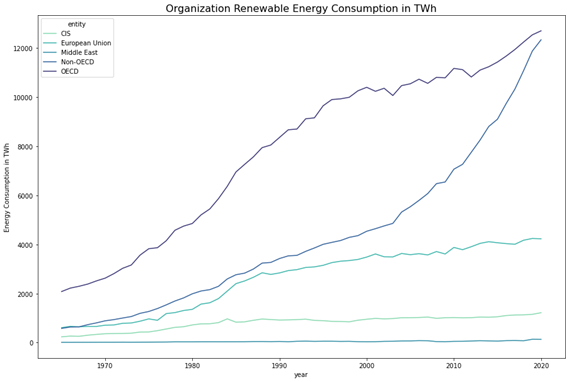
Meanwhile, the use of renewable energy is still being led by OECD countries because a lot of research is being carried out in that country.
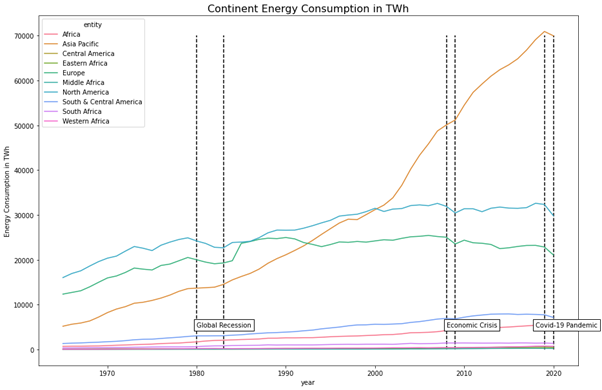
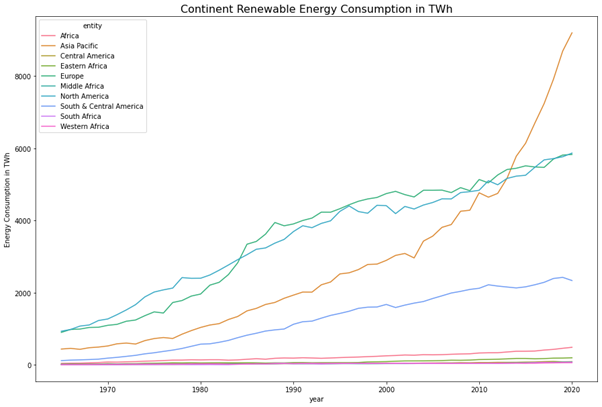
As for the energy consumption of each continent, the highest in the Asia Pacific, this is due to the shifting of the manufacturing area to Asia. Meanwhile, renewable energy is also the most abundant in the Asia Pacific because there is significant growth in China and many other countries with ambitious projects and energy councils.
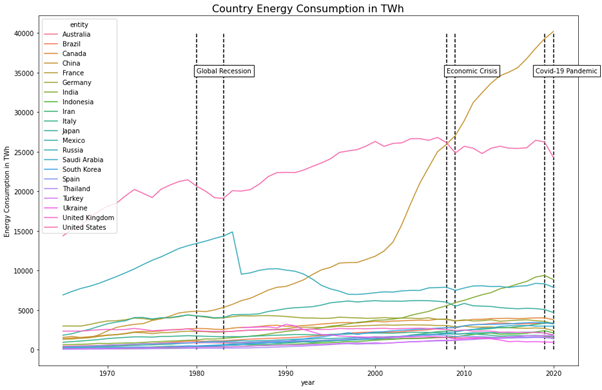
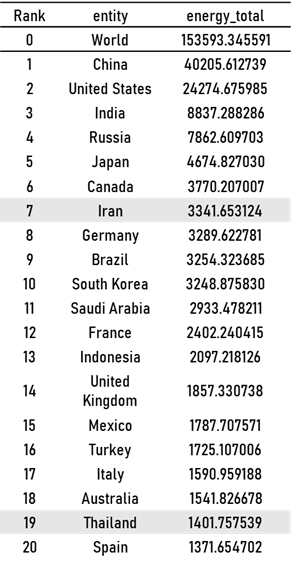
China has the highest energy consumption, followed by the US. The US rate is fixed because industrialization is already saturated. When viewed from the rank of 20 countries, it can be seen that the 18 countries with the highest energy consumption are G20 countries, so energy consumption is influenced by GDP.
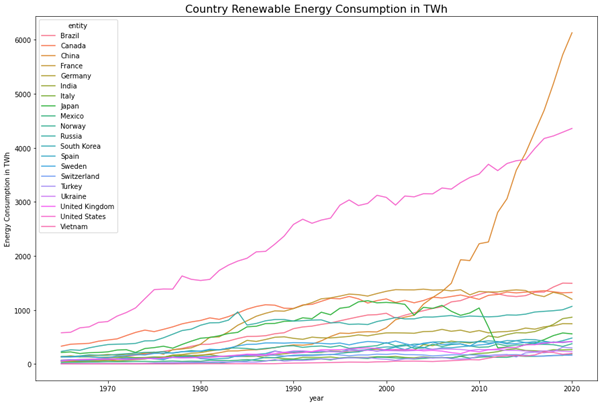
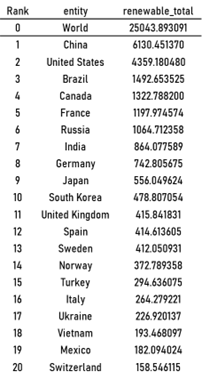
As for renewable energy, the highest is in China and followed by the United States. The amount of renewable energy is influenced by state policy and R&D, as well as global pressure.
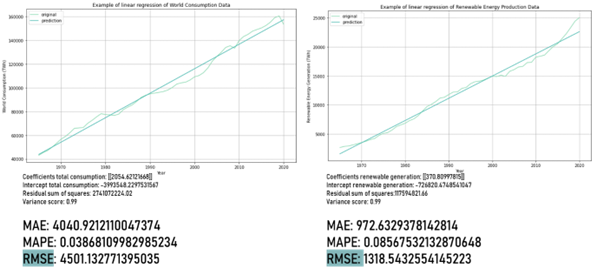
Simple linear regression modeling has been conducted to obtain the coefficient and intercept. Simple linear regression is used as the baseline for selecting the forecast model in this study. MAE, MAPE, and RMSE parameters are used to check the error of the predicted value against the actual value. The values of MAE and RMSE are similar, so there are no anomaly errors, and the model can represent the data.
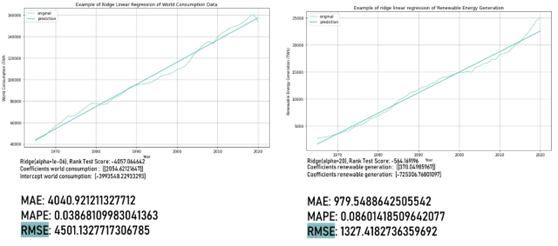
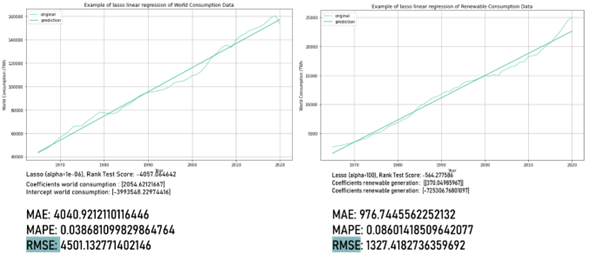
Ridge and lasso regression was also performed on the data. Hyperparameter tuning is done to get the best alpha for ridge and lasso regression. The following are the results of the ridge and lasso regression and the values for MAE, MAPE, and RMSE.
Then, I conduct time series forecasting because the parameter that affects energy consumption is time. Time-series forecasting models can predict future values based on previous values. Time series can be divided into several parts, namely:
- Trend: increase or decrease in the value of the data.
- Seasonality: repetitive pattern seen in the data series.
- Residue is the residual value of the data after extracting trend and seasonality.
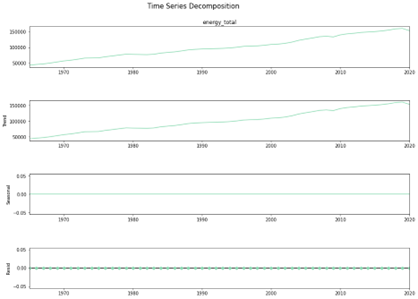
The figure above shows that data has a trend and no seasonality. Then a stationarity check is carried out to determine which time series analysis can be applied to our data. After the transformation using shift and log transformation, the transformed data is evaluated using Augmented Dickey-Fuller (ADF). The data is stationary. The augmented Dickey-Fuller Stationarity Test (ADF) is a test performed on time-series data to determine whether the time series data is stationary or not.
Some time-series analyses require that the data be stationary before further analysis, such as data analysis using ARIMA. Therefore, a stationarity test needs to be carried out to fulfil these requirements.
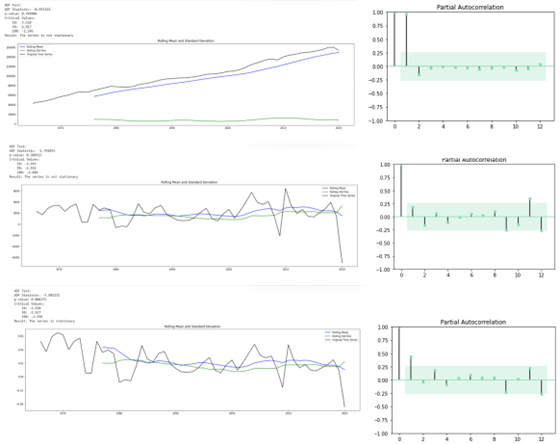
The figure above shows that data is stationary. I tried to apply simple exponential smoothing, holt exponential smoothing, and ARIMA (Auto-Regressive Integrated Moving Average) in this study.
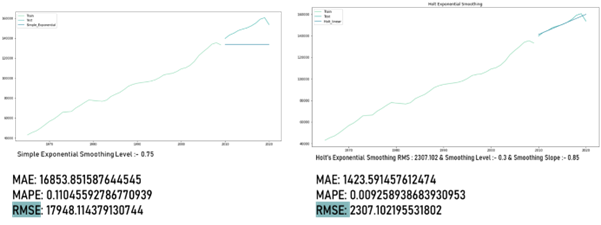
The figure above shows that the values of MAE, MAPE, and RMSE, which tend to be larger because of their simple exponential characteristics, are suitable for data that does not have a trend but has seasonality. Meanwhile, in Holt's Exponential Smoothing, it can be seen that MAE, MAPE, and RMSE tend to be small because the data has a trend and does not have seasonality.
Next, the ARIMA time series (Auto-Regressive Integrated Moving Average) is applied to the data. There are three variables in ARIMA, namely Auto-Regressive (p), Integrated (d), and Moving Average (q). The ARIMA variable value was calculated using the auto arima function.
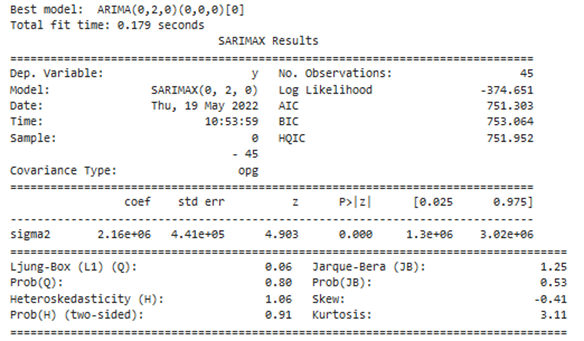
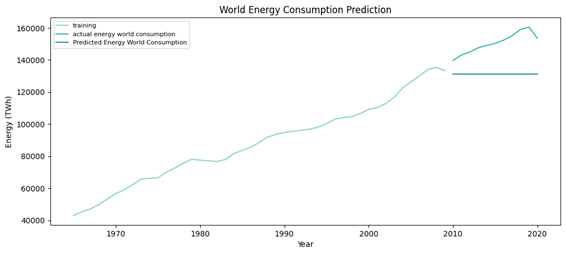
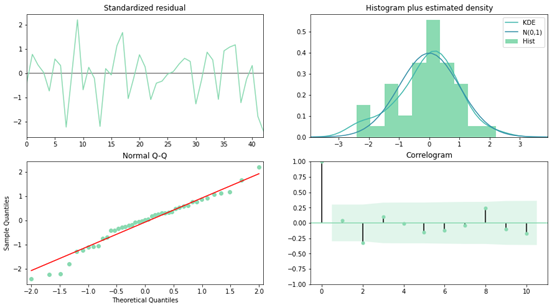
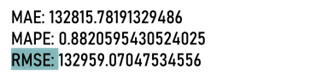
The result is that the MAE, MAPE, and RMSE values remain relatively large because ARIMA is more suitable for data that has trend and seasonality.
Stationary check has been done to renewable energy data.
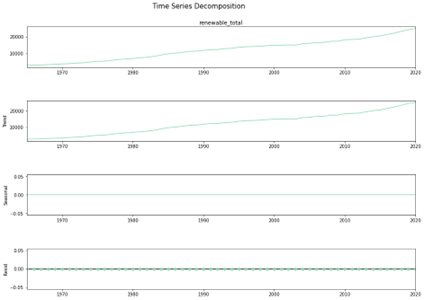
The figure above shows that data has a trend and no seasonality.
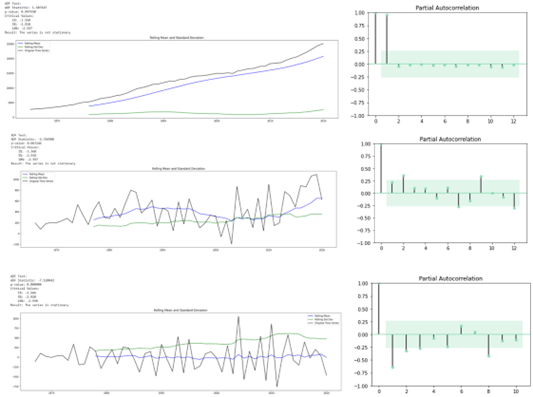
After the transformation using twice shift transformation, the transformed data is evaluated using Augmented Dickey-Fuller (ADF). The data is stationary.
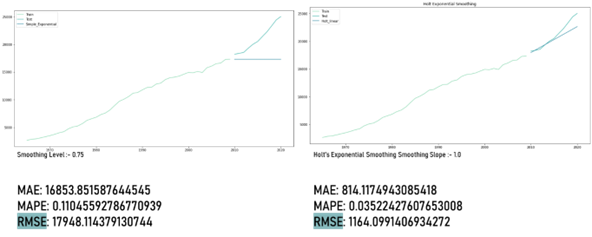
The figure above shows that the values of MAE, MAPE, and RMSE, which tend to be larger because of their simple exponential characteristics, are suitable for data that does not have a trend but has seasonality. Meanwhile, in Holt's Exponential Smoothing, it can be seen that MAE, MAPE, and RMSE tend to be small because the data has a trend and does not have seasonality.
The ARIMA variable value was calculated using the auto arima function.
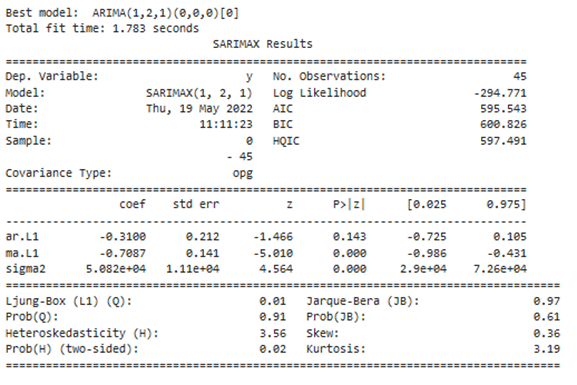
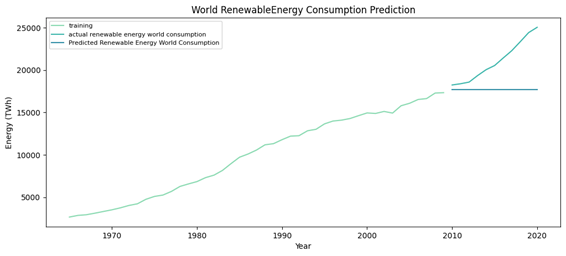
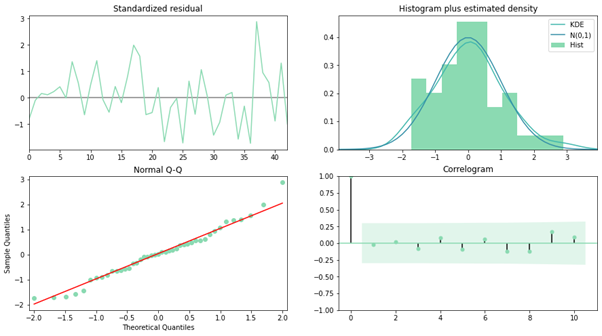
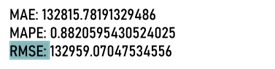
The result is that the MAE, MAPE, and RMSE values remain relatively large because ARIMA is more suitable for data that has trend and seasonality.


Model evaluation was carried out using MAE mape and RMSE values. R square is not used for evaluation to avoid bias because r square is very suitable for linear regression. Holt exponential smoothing was chosen to forecast world energy consumption and renewable energy consumption because it has the smallest MAE, MAPE, and RMSE values.
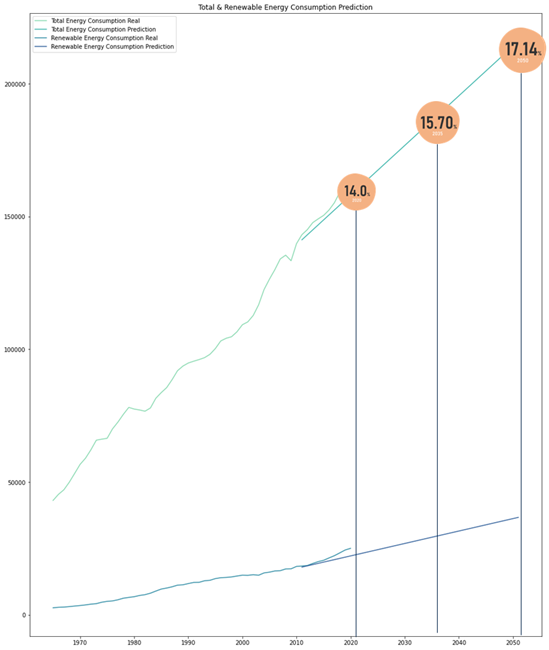

Prediction results with current energy consumption, the projection of renewable energy on world energy consumption in 2035 is only 15.70% of the 35% target. Meanwhile, in 2050 it will only reach 17.14% of the target, which is 50%. So there needs to be a disruption in energy use in 2 ways, namely reducing consumption, namely by energy efficiency and adding a renewable energy mix.
For the follow-up action, I added clustering so that the regional solutions and policies provided are in accordance with the nature of the consumption pattern of the renewable energy mix. So that the policy can provide a smooth transition and significant results. Here I use Kmeans without PCA because I want to see the overall pattern of energy use. Based on the elbow method, the cluster can be divided into 4 and 5 clusters.
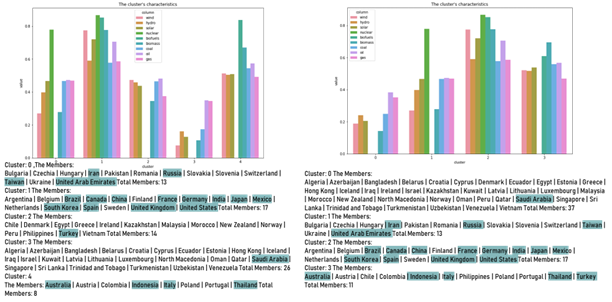
Based on my personal judgment, I chose to divide the cluster into 4 based on the country based on the characteristics of the countries in the cluster. The four clusters are Agricultural and Service Based Country, Fossil Fuel Producers, Emission Intensive Producer, and Emerging Energy Consumer Countries. From this division, the policy regarding renewable energy should be prioritized from emission-intensive producers, fossil fuel producers, emerging energy consumer countries, to agricultural and service based countries. The priority of renewable energy can also be adjusted by the majority of renewable energy in the country to accelerate the rate of increase in renewable energy.
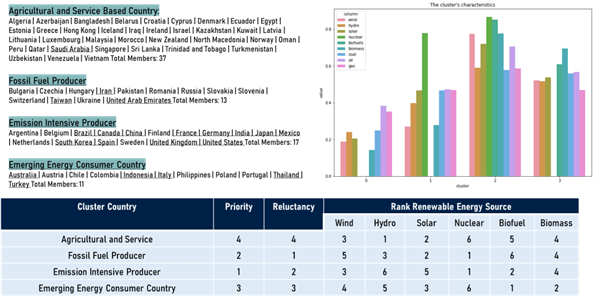
The forecast results show that the Net Zero Energy Mix target failed to meet the target of only 15.70% from 35% in 2035 and only 17.14% of 50% in 2050 so efforts were needed to accelerate an increase in the increase in renewable energy.
To accelerate the process of achieving the Net Zero Energy Mix target, a regional policy variation and effort is required according to the nature of the consumption of each country according to the results of the clustering.
Forecasting needs to be done with more advanced methods such as fbprophet or LSTM to forecast Total Energy Consumption and Renewable Energy Consumption.